In the modern age, building our web apps so that they can be used on mobile devices is critical. As a web developer, being able to debug problems that surface in a mobile experience can present some obstacles. In this post we look at 5 quick tips to help you get started with debugging your Rails applications on mobile web.
Introduction
With mobile website traffic outstripping desktop over the last number of years[1], the mobile web experience
has become the de facto standard for the majority of web users.
In the past, responsibility for mobile-friendliness may have been viewed as a chore. However, in the modern landscape it is both your main audience and your key
opportunity.
In addition to the inexorable growth of mobile users and ergo mobile traffic, web technologies have developed a-pace
in recent times. The browser platform now offers support for a richer user experience, often blurring the line between that which
can be delivered in a web browser, and that which should be delivered via a native mobile app. Motivators for opting to deliver
functionality via a native app are being slowly eroded in many cases.
The combination of these factors means that we have a booming mobile web audience, with more sophisticated functionality being delivered to this
audience. In such an environment it is incumbent upon web developers to ensure their sites and apps work well on mobile devices. Even where
a native app is available, if your users can access your site or app in a mobile browser you can be sure that some will try to do so.
Generally, developing for mobile web is a straighforward experience. As web developers we are still dealing with the familiar web technologies
and tools that we are used to. Nonetheless, mobile web dev can throw up a couple of unexpected obstacles along the way, in particular when we
need to debug on a physical device.
In this post I have compiled a few brief pointers which I have revisited frequently in recent times. My typical development environment will involve
a Rails server running on a Ubuntu OS (e.g. 20.04), using Chrome DevTools for front-end debugging. The physical mobile device will usuallly be a
low-end Android device, a Ulefone Note 12P in the following demonstrations. These tips will definitely have a bias to this particular setup, but I
think most of the discussion is sufficiently general so as to be useful to other development setups.
So if you are having issues getting your mobile web debugging set up, read on!
Tips for Debugging Mobile Web
I have tried to list these tips in the order in which you might need encounter them. Without further ado …
Use built-in browser simulators
This post mainly discusses the problems encountered when trying to debug on a physical mobile device, but the good news is that you
really don't need to do that too often. Modern browsers usually offer some form of mobile simulation, for example Chrome offers
Device Mode .
Other articles (e.g. [5]) already detail how you can get up and running with these
browser-based simulators, so I will direct you there for more details on getting started.
Using these built-in simulators wll usually get you about 95% of the way and, as they are right there in your regular front-end debugging environment, this
should always be your first port of call. Activate the simulator in your browser, visit the URL you are trying to debug then relax in the comfort
of the DevTools that you know and love.
I reiterate for effect: If you encounter a problem on mobile web you should first attempt to recreate the issue in a browser-based mobile
simulator. Often the problem will surface in the simulator and you will not need to go past this step. That being said, there are occassions
where the simulator doesn't precisely simulate the problem you are trying to address. Some particular examples which I have
encountered on a recurring basis:
The revealing and hiding of the soft-keyboard on an actual device is not present on the simulator
The simulator replaces your fingertip with a course touch point. I find this to be more precise than a physical fingertip (mine anyway!), so selection is sometimes more difficult on a real device
Also the simulator cursor can't recreate the screen obstruction caused by your hand when you actually interact with your physical finger
These are just some of the reasons why, sometimes, you really do need to test something out on a physical mobile device.
Get your networking sorted
When trying to debug your local development environment from a mobile browser the first question you might ask is: How do I actually hit my local server?
Often these networking concerns just don't surface in a typical development setup [3]; your server runs
on your local machine and your browser can simply hit the server using localhost or 127.0.0.1.
There are two aspects to the solution. We need to expose our server to the local network and we need to know how to hit that server from our mobile
browser on the same local network.
Step 1: For a Rails server the default behaviour is to only bind to localhost. This is for security reasons, and it ensures
that if we run bundle exec rails s the server will spin up, but will only respond to local traffic. We need to open up our server so that it
will respond to traffic coming from outside of localhost. To achieve this we can start the Rails server as:
> bundle exec rails s --binding=0.0.0.0
Binding to 0.0.0.0 tells your Rails server to listen to all IP addresses on your machine, which should allow us to address it from another device
on the network. So our Rails server is now exposed to external traffic, how do we tell our mobile browser to make an HTTP request to this machine? To do this
we will need the IP address of our development machine on the local network. On Linux I usually get that by manually parsing the ifconfig
command. Admittedly there is a lot of superfluous noise in this command for our present needs, so for the purpose of this post, the folllowing command should
return the IPv4 address that you need, no extra fuss:
      > hostname -I | awk '{print $1}'
      192.168.1.106
Armed with this IP and the port upon-which your server is listening, you should be able to use your mobile browser to make a request to your server. For my
rails server, which runs on port 3000 by default, typing the following into the address bar of the mobile browser will be enough to get a response from the
server: http://192.168.1.106:3000.
Install and run adb
The Android Debug Bridge, or adb, is a package that comes bundled with
the Android SDK Platorm-Tools. It will be needed to communicate with the USB-connected mobile device.
On Ubuntu adb can be installed using a simple apt install command:
> sudo apt-get install android-tools-adb
For steps to install adb on another OS I direct you to this
article, which details the installation of adb on different environments.
ADB allows your development machine to communicate with mobile devices that are connected over USB, it does this by running an adb
server on your local machine, which will respond to adb commands that you issue from the command line. These commands will be relayed
to the connected mobile device. The USB-connected Android device will have a background daemon running (adbd) to listen for, and execute,
the commands issued from the adb server. Before you start debugging you will often need to start the adb server, which can
be achieved with the following:
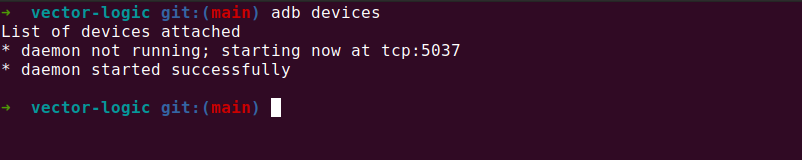
> adb devices
This adb devices command will request a list of connected devices, and it will start the adb server if it is not yet running:
Starting the ADB server on development machine (Ubuntu 20.04).
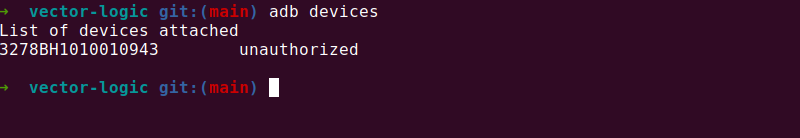
If you connect your mobile device via USB at this point and rerun the adb devices you are hoping to see your device listed, but it is
possible that you will see the list empty or with your device registered as unauthorized. In this case you will need to ensure that
your mobile device is setup for USB debugging
USB-connected Android device not yet authorized (Ubuntu 20.04).
Ensure phone allows USB debugging
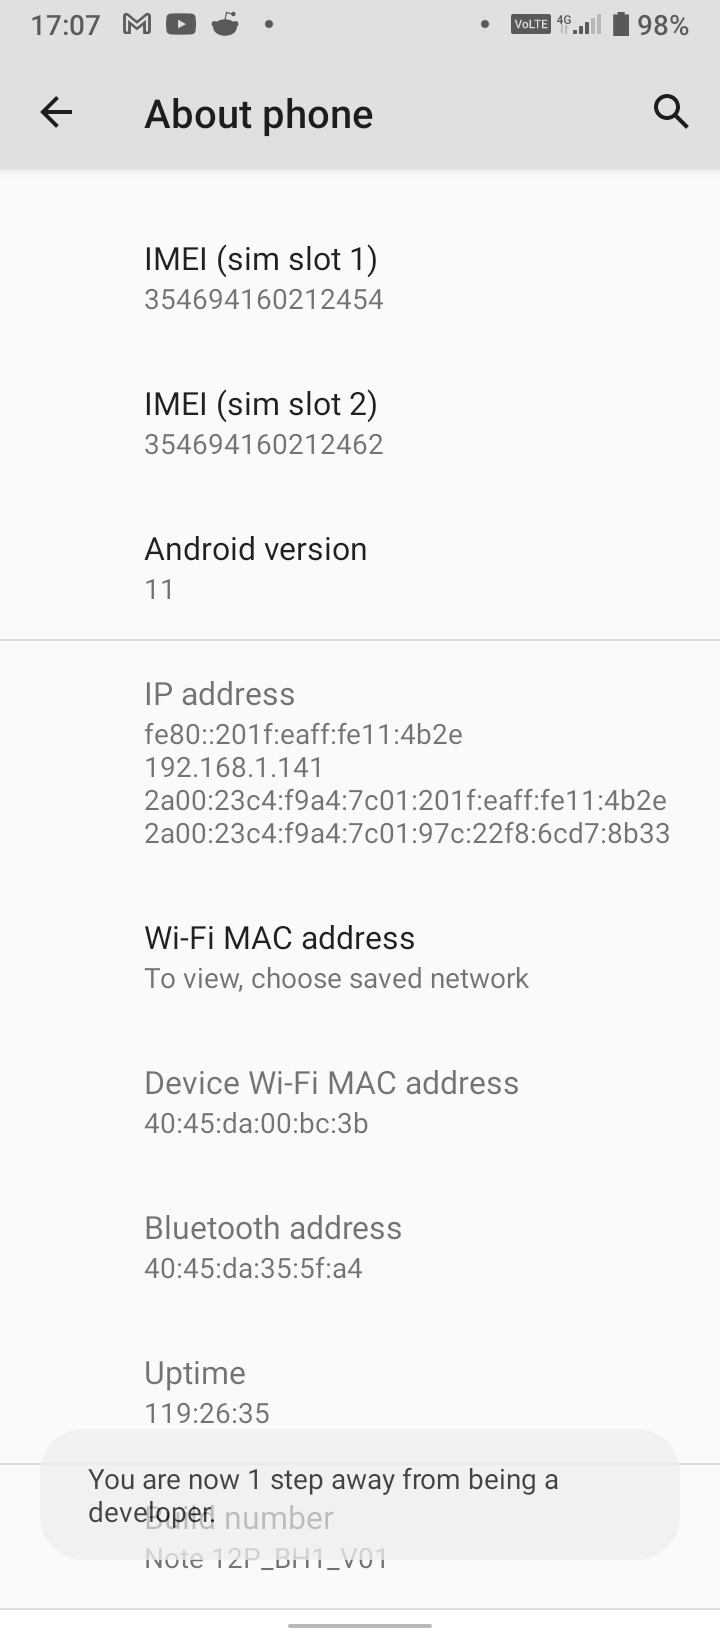
Before communicating with your development machine over USB you will need to enable this for your Android device. First you should enable
developer-mode on your phone: Navigate to Settings > About > Build Number and tap the Build Number
repeatedly (7 times is the magic number, apparently). You should receive a notification that you have enabled developer-mode on your phone:
Enabling developer-mode on an Android device (Ulefone Note 12P).
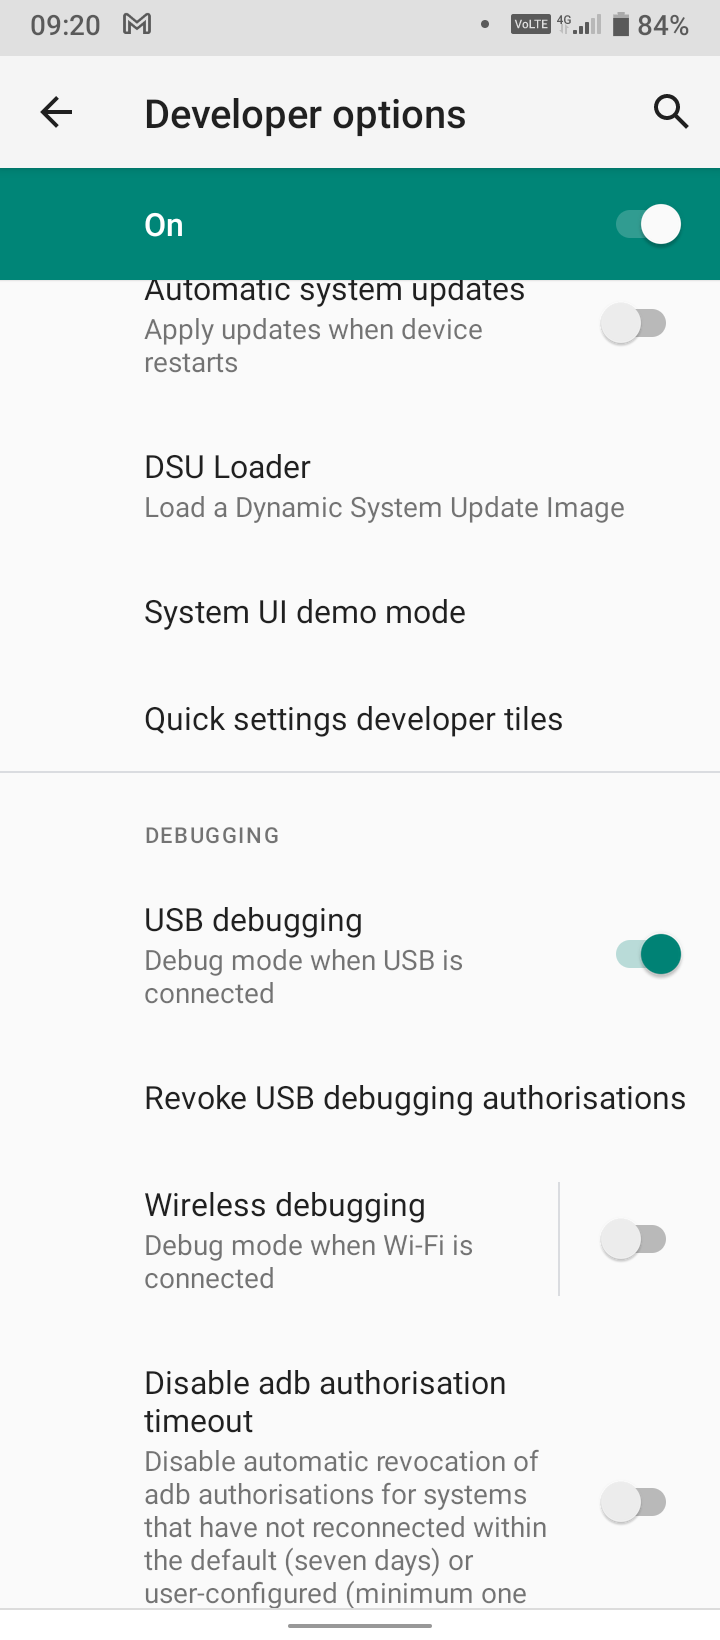
Once you have done this you should navigate to, or search for, Developer options on your phone. Within this section find the option
for USB debugging and ensure that this is enabled.
Enabling developer-mode on an Android device (Ulefone Note 12P).
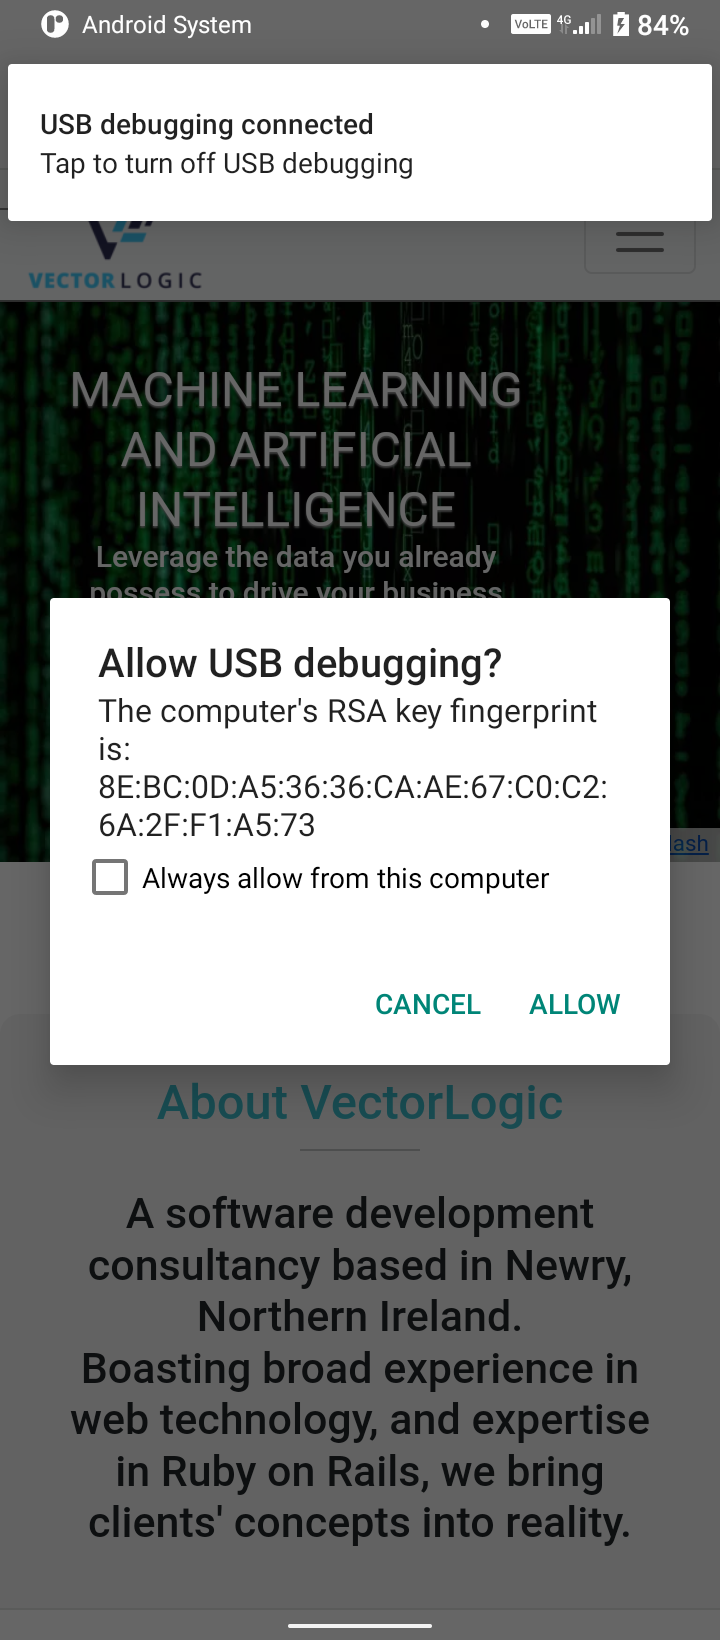
With these steps complete, when you connect (or reconnect) your device to your
development machine the adb server should detect the device and request permission to enable USB debugging, which you can accept
on the device.
ADB debugging permission modal, on connecting a USB-enabled device..
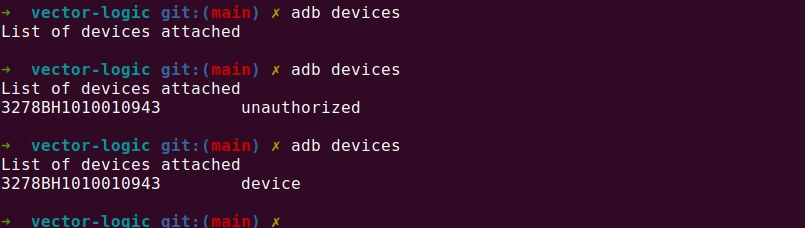
Running adb devices should now show your device as successfully registered. For clarity the screenshot below illustrates the three
different states for our device:
before USB debugging is enabled
after USB debugging is enabled but before permission has been granted
after permission has been granted
Illustrating states reported by adb devices command (Ulefone Note 12P).
With your device registered in this way it means that the adb server on your local machine will be able to send commands to this
registered device and drive the debugging process. But what is our interface to this debugging process?
chrome://inspect#devices
Having started-up the adb server, enabled USB debugging on your device and granted permission for you local development
machine to talk to your device, you should be all ready to start debugging. On your development machine you should open Chrome and
enter the following in the address bar:
chrome://inspect#devices
This URL begins with the chrome:// protocol which exposes a number of useful development APIs in your browser.
In this case we are accessing the inspect path which presents an interface into a number of web debugging resources.
For example, if you navigate to the pages menu item you should see a list of the Chrome tabs open on your local machine, and you can
launch your regular DevTools debugging experience from this point. In fact, your familiar embedded DevTools experience will use this
chrome://-protocol under the hood to drive your day-to-day debugging activities.
As well as the pages listing you can also get a top-level view of Extensions or Service Workers installed
on your browser.
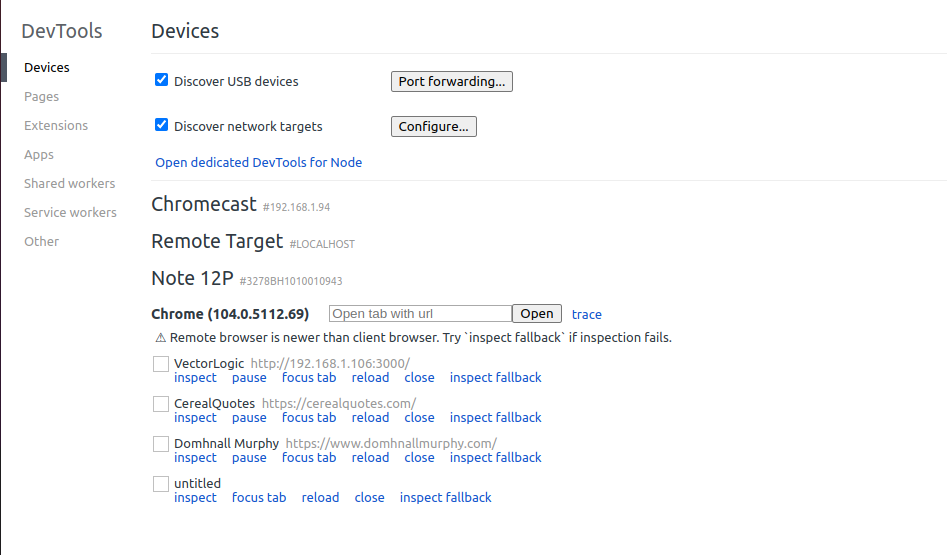
Accessing chrome:://inspect#devices on your development machine will list your connected devices.
In this case we want to inspect the devices option, which should list any remote devices that have been connected, and been
enabled for debuggng. In your case you should hopefully see your mobile device listed, with an entry of each Chrome tab open in your
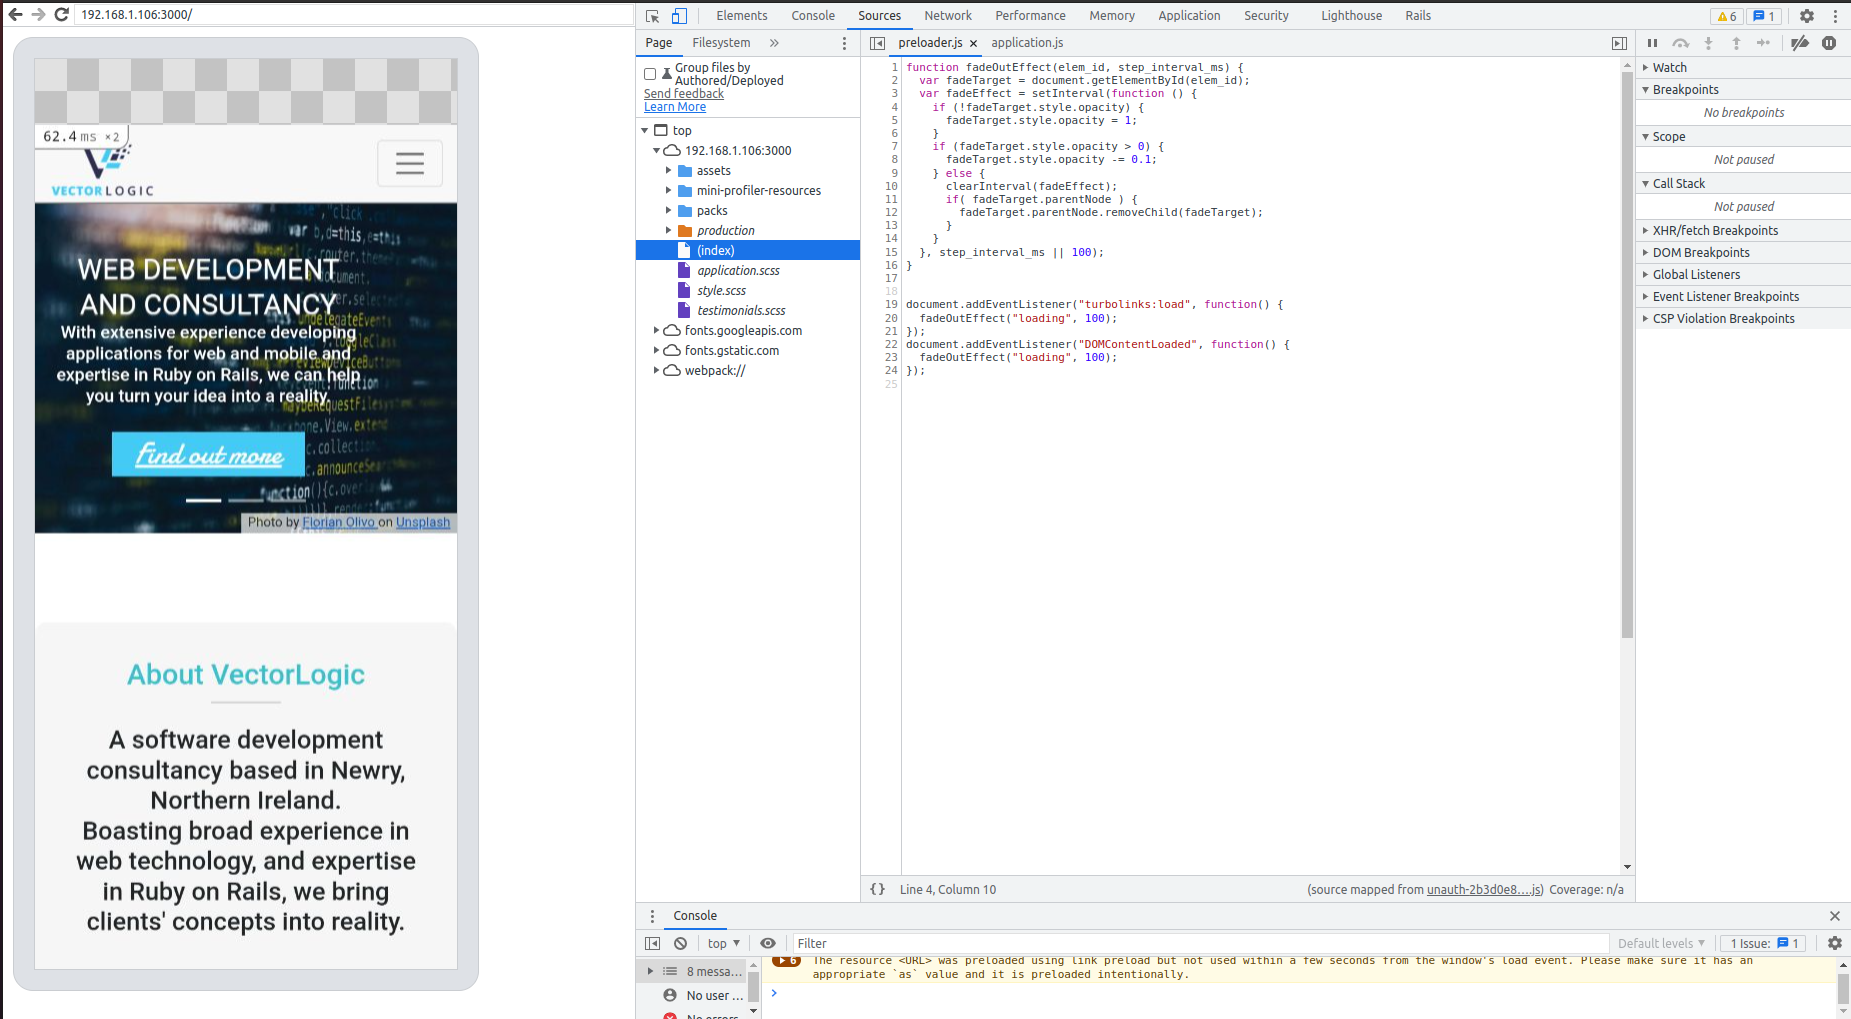
mobile browser [7]. From here you should be able to choose to inspect the tab you wish to debug. The mobile screen will
be mirrored in your browser and you will have access to all the usual DevTools functions including element inspection, network activity, source code etc.
With debugging setup you should be able to select from the tabs open in your mobile browser, and inspect using all the DevTools functionality.
Note that, with the debugger attached, you should be able to drive the mobile device from your development browser or directly on the mobile device.
Summary
This post has outlined some brief tips to help you get unblocked with debugging your Rails application on mobile web. In the first instance try to use a device emulator.
When this fails switch to using a physical device. When using an Android device you should install and run adb on your local development machine and
ensure you have enable mobile debugging on your device.
References
Globally, 68.1% of all website visits in 2020 came from mobile devices [Perficient study]
That being said, the increased use of docker in modern developments environments means that networking considerations have made their way into the day-to-day
work for many developers.
After connecting your device via USB I have often seen a delay of a few minutes before the device is registered under chrome://inspect#devices, not sure why

Comments
There are no existing comments
Got your own view or feedback? Share it with us below …